


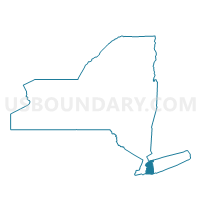
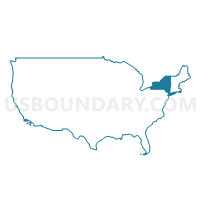
Oyster Bay town, Nassau County, New York
About
Outline

Summary
| Unique Area Identifier | 143207 |
| Name | Oyster Bay town |
| County | Nassau County |
| State | New York |
| Area (square miles) | 169.40 |
| Land Area (square miles) | 103.75 |
| Water Area (square miles) | 65.65 |
| % of Land Area | 61.24 |
| % of Water Area | 38.76 |
| Latitude of the Internal Point | 40.79784960 |
| Longtitude of the Internal Point | -73.51102690 |
| Total Population | 293,214 |
| Total Housing Units | 102,849 |
| Total Households | 99,419 |
| Median Age | 43.1 |
Maps

Graphs
Select a template below for downloading or customizing gragh for Oyster Bay town, Nassau County, New York


Neighbors
Neighoring County Subdivision (by Name) Neighboring County Subdivision on the Map
- Babylon town, Suffolk County, NY
- County subdivisions not defined, Fairfield County, CT
- Darien town, Fairfield County, CT
- Glen Cove city, Nassau County, NY
- Greenwich town, Fairfield County, CT
- Hempstead town, Nassau County, NY
- Huntington town, Suffolk County, NY
- North Hempstead town, Nassau County, NY
- Rye city, Westchester County, NY
- Stamford town, Fairfield County, CT
Top 10 Neighboring Place (by Population) Neighboring Place on the Map
- Stamford city, CT (122,643)
- Levittown CDP, NY (51,881)
- Hicksville CDP, NY (41,547)
- Glen Cove city, NY (26,964)
- Plainview CDP, NY (26,217)
- Massapequa CDP, NY (21,685)
- Darien CDP, CT (20,732)
- East Massapequa CDP, NY (19,069)
- Melville CDP, NY (18,985)
- Syosset CDP, NY (18,829)
Top 10 Neighboring Unified School District (by Population) Neighboring Unified School District on the Map
- Stamford School District, CT (122,643)
- Greenwich School District, CT (61,171)
- East Meadow Union Free School District, NY (52,102)
- Half Hollow Hills Central School District, NY (48,558)
- Massapequa Union Free School District, NY (47,145)
- Levittown Union Free School District, NY (46,540)
- Farmingdale Union Free School District, NY (39,909)
- Hicksville Union Free School District, NY (39,700)
- South Huntington Union Free School District, NY (38,650)
- Northport-East Northport Union Free School District, NY (36,113)
Top 10 Neighboring State Legislative District Lower Chamber (by Population) Neighboring State Legislative District Lower Chamber on the Map
- Assembly District 10, NY (138,509)
- Assembly District 15, NY (135,528)
- Assembly District 11, NY (135,087)
- Assembly District 16, NY (134,747)
- Assembly District 13, NY (131,694)
- Assembly District 9, NY (130,285)
- Assembly District 19, NY (128,933)
- Assembly District 91, NY (128,861)
- Assembly District 8, NY (128,281)
- Assembly District 12, NY (126,438)
Top 10 Neighboring State Legislative District Upper Chamber (by Population) Neighboring State Legislative District Upper Chamber on the Map
- State Senate District 37, NY (326,645)
- State Senate District 5, NY (316,844)
- State Senate District 7, NY (311,141)
- State Senate District 4, NY (309,135)
- State Senate District 6, NY (307,789)
- State Senate District 8, NY (305,226)
- State Senate District 27, CT (103,721)
- State Senate District 36, CT (96,890)
- State Senate Districts not defined, CT (0)
Top 10 Neighboring 111th Congressional District (by Population) Neighboring 111th Congressional District on the Map
- Congressional District 4, CT (706,740)
- Congressional District 2, NY (679,893)
- Congressional District 18, NY (674,825)
- Congressional District 5, NY (670,130)
- Congressional District 4, NY (663,407)
- Congressional District 3, NY (645,508)
Top 10 Neighboring Census Tract (by Population) Neighboring Census Tract on the Map
- Census Tract 1122.06, Suffolk County, NY (8,271)
- Census Tract 5172, Nassau County, NY (8,058)
- Census Tract 5177.01, Nassau County, NY (7,636)
- Census Tract 1233.01, Suffolk County, NY (7,415)
- Census Tract 5189, Nassau County, NY (6,999)
- Census Tract 5220, Nassau County, NY (6,919)
- Census Tract 4088, Nassau County, NY (6,829)
- Census Tract 5200.01, Nassau County, NY (6,790)
- Census Tract 5185.01, Nassau County, NY (6,762)
- Census Tract 5180, Nassau County, NY (6,707)
Top 10 Neighboring 5-Digit ZIP Code Tabulation Area (by Population) Neighboring 5-Digit ZIP Code Tabulation Area on the Map
- 11758, NY (53,804)
- 11590, NY (45,768)
- 11756, NY (42,791)
- 11743, NY (42,230)
- 11801, NY (39,553)
- 11793, NY (32,298)
- 11735, NY (32,098)
- 11050, NY (30,171)
- 11803, NY (28,127)
- 11542, NY (27,633)
Data
Demographic, Population, Households, and Housing Units
** Data sources from census 2010 **
Show Data on Map
Download Full List as CSV
Download Quick Sheet as CSV
| Subject | This Area | Nassau County | New York | National |
|---|---|---|---|---|
| POPULATION | ||||
| Total Population Map | 293,214 | 1,339,532 | 19,378,102 | 308,745,538 |
| POPULATION, HISPANIC OR LATINO ORIGIN | ||||
| Not Hispanic or Latino Map | 271,291 | 1,144,177 | 15,961,180 | 258,267,944 |
| Hispanic or Latino Map | 21,923 | 195,355 | 3,416,922 | 50,477,594 |
| POPULATION, RACE | ||||
| White alone Map | 249,159 | 977,577 | 12,740,974 | 223,553,265 |
| Black or African American alone Map | 6,657 | 149,049 | 3,073,800 | 38,929,319 |
| American Indian and Alaska Native alone Map | 442 | 3,185 | 106,906 | 2,932,248 |
| Asian alone Map | 26,723 | 102,266 | 1,420,244 | 14,674,252 |
| Native Hawaiian and Other Pacific Islander alone Map | 34 | 336 | 8,766 | 540,013 |
| Some Other Race alone Map | 5,596 | 75,211 | 1,441,563 | 19,107,368 |
| Two or More Races Map | 4,603 | 31,908 | 585,849 | 9,009,073 |
| POPULATION, SEX | ||||
| Male Map | 142,056 | 647,978 | 9,377,147 | 151,781,326 |
| Female Map | 151,158 | 691,554 | 10,000,955 | 156,964,212 |
| POPULATION, AGE (18 YEARS) | ||||
| 18 years and over Map | 225,326 | 1,027,952 | 15,053,173 | 234,564,071 |
| Under 18 years | 67,888 | 311,580 | 4,324,929 | 74,181,467 |
| POPULATION, AGE | ||||
| Under 5 years | 14,466 | 73,888 | 1,155,822 | 20,201,362 |
| 5 to 9 years | 18,055 | 83,405 | 1,163,955 | 20,348,657 |
| 10 to 14 years | 21,536 | 93,607 | 1,211,456 | 20,677,194 |
| 15 to 17 years | 13,831 | 60,680 | 793,696 | 12,954,254 |
| 18 and 19 years | 7,029 | 33,390 | 572,582 | 9,086,089 |
| 20 years | 3,287 | 16,433 | 293,083 | 4,519,129 |
| 21 years | 3,267 | 15,515 | 281,596 | 4,354,294 |
| 22 to 24 years | 9,390 | 47,428 | 836,256 | 12,712,576 |
| 25 to 29 years | 13,049 | 71,252 | 1,380,177 | 21,101,849 |
| 30 to 34 years | 13,165 | 71,304 | 1,279,160 | 19,962,099 |
| 35 to 39 years | 16,405 | 80,583 | 1,254,124 | 20,179,642 |
| 40 to 44 years | 21,983 | 97,049 | 1,355,893 | 20,890,964 |
| 45 to 49 years | 25,704 | 109,918 | 1,458,763 | 22,708,591 |
| 50 to 54 years | 25,370 | 108,067 | 1,419,928 | 22,298,125 |
| 55 to 59 years | 21,216 | 93,403 | 1,237,408 | 19,664,805 |
| 60 and 61 years | 7,488 | 33,471 | 453,993 | 7,113,727 |
| 62 to 64 years | 10,094 | 45,458 | 612,267 | 9,704,197 |
| 65 and 66 years | 5,287 | 23,743 | 330,160 | 5,319,902 |
| 67 to 69 years | 7,178 | 31,836 | 443,051 | 7,115,361 |
| 70 to 74 years | 10,017 | 42,728 | 587,391 | 9,278,166 |
| 75 to 79 years | 9,215 | 37,942 | 474,807 | 7,317,795 |
| 80 to 84 years | 8,599 | 34,375 | 391,660 | 5,743,327 |
| 85 years and over | 7,583 | 34,057 | 390,874 | 5,493,433 |
| MEDIAN AGE BY SEX | ||||
| Both sexes Map | 43.10 | 41.10 | 38.00 | 37.20 |
| Male Map | 41.80 | 39.50 | 36.30 | 35.80 |
| Female Map | 44.20 | 42.70 | 39.40 | 38.50 |
| HOUSEHOLDS | ||||
| Total Households Map | 99,419 | 448,528 | 7,317,755 | 116,716,292 |
| HOUSEHOLDS, HOUSEHOLD TYPE | ||||
| Family households: Map | 78,232 | 340,523 | 4,649,791 | 77,538,296 |
| Husband-wife family Map | 65,452 | 269,043 | 3,192,903 | 56,510,377 |
| Other family: Map | 12,780 | 71,480 | 1,456,888 | 21,027,919 |
| Male householder, no wife present Map | 3,520 | 19,088 | 366,948 | 5,777,570 |
| Female householder, no husband present Map | 9,260 | 52,392 | 1,089,940 | 15,250,349 |
| Nonfamily households: Map | 21,187 | 108,005 | 2,667,964 | 39,177,996 |
| Householder living alone Map | 17,753 | 90,292 | 2,130,670 | 31,204,909 |
| Householder not living alone Map | 3,434 | 17,713 | 537,294 | 7,973,087 |
| HOUSEHOLDS, HISPANIC OR LATINO ORIGIN OF HOUSEHOLDER | ||||
| Not Hispanic or Latino householder: Map | 94,386 | 403,960 | 6,311,241 | 103,254,926 |
| Hispanic or Latino householder: Map | 5,033 | 44,568 | 1,006,514 | 13,461,366 |
| HOUSEHOLDS, RACE OF HOUSEHOLDER | ||||
| Householder who is White alone | 88,536 | 353,551 | 5,169,163 | 89,754,352 |
| Householder who is Black or African American alone | 1,642 | 43,735 | 1,095,790 | 14,129,983 |
| Householder who is American Indian and Alaska Native alone | 99 | 733 | 33,824 | 939,707 |
| Householder who is Asian alone | 7,027 | 27,342 | 445,652 | 4,632,164 |
| Householder who is Native Hawaiian and Other Pacific Islander alone | 8 | 76 | 2,615 | 143,932 |
| Householder who is Some Other Race alone | 1,181 | 15,875 | 405,320 | 4,916,427 |
| Householder who is Two or More Races | 926 | 7,216 | 165,391 | 2,199,727 |
| HOUSEHOLDS, HOUSEHOLD TYPE BY HOUSEHOLD SIZE | ||||
| Family households: Map | 78,232 | 340,523 | 4,649,791 | 77,538,296 |
| 2-person household Map | 26,937 | 113,285 | 1,785,206 | 31,882,616 |
| 3-person household Map | 17,948 | 77,508 | 1,109,716 | 17,765,829 |
| 4-person household Map | 19,891 | 80,219 | 944,590 | 15,214,075 |
| 5-person household Map | 8,942 | 40,700 | 461,667 | 7,411,997 |
| 6-person household Map | 2,951 | 15,982 | 189,577 | 3,026,278 |
| 7-or-more-person household Map | 1,563 | 12,829 | 159,035 | 2,237,501 |
| Nonfamily households: Map | 21,187 | 108,005 | 2,667,964 | 39,177,996 |
| 1-person household Map | 17,753 | 90,292 | 2,130,670 | 31,204,909 |
| 2-person household Map | 2,811 | 13,994 | 430,564 | 6,360,012 |
| 3-person household Map | 381 | 1,981 | 66,787 | 992,156 |
| 4-person household Map | 134 | 896 | 24,877 | 411,171 |
| 5-person household Map | 62 | 399 | 8,596 | 126,634 |
| 6-person household Map | 24 | 227 | 3,400 | 48,421 |
| 7-or-more-person household Map | 22 | 216 | 3,070 | 34,693 |
| HOUSING UNITS | ||||
| Total Housing Units Map | 102,849 | 468,346 | 8,108,103 | 131,704,730 |
| HOUSING UNITS, OCCUPANCY STATUS | ||||
| Occupied Map | 99,419 | 448,528 | 7,317,755 | 116,716,292 |
| Vacant Map | 3,430 | 19,818 | 790,348 | 14,988,438 |
| HOUSING UNITS, OCCUPIED, TENURE | ||||
| Owned with a mortgage or a loan Map | 57,706 | 243,840 | 2,610,123 | 52,979,430 |
| Owned free and clear Map | 28,704 | 114,460 | 1,287,714 | 23,006,644 |
| Renter occupied Map | 13,009 | 90,228 | 3,419,918 | 40,730,218 |
| HOUSING UNITS, VACANT, VACANCY STATUS | ||||
| For rent Map | 618 | 4,557 | 200,039 | 4,137,567 |
| Rented, not occupied Map | 61 | 374 | 12,786 | 206,825 |
| For sale only Map | 703 | 4,361 | 77,225 | 1,896,796 |
| Sold, not occupied Map | 312 | 1,298 | 21,027 | 421,032 |
| For seasonal, recreational, or occasional use Map | 808 | 4,073 | 289,301 | 4,649,298 |
| For migrant workers Map | 0 | 3 | 892 | 24,161 |
| Other vacant Map | 928 | 5,152 | 189,078 | 3,652,759 |
| HOUSING UNITS, OCCUPIED, AVERAGE HOUSEHOLD SIZE BY TENURE | ||||
| Total: Map | 2.89 | 2.94 | 2.57 | 2.58 |
| Owner occupied Map | 2.97 | 3.03 | 2.71 | 2.65 |
| Renter occupied Map | 2.39 | 2.58 | 2.41 | 2.44 |
| HOUSING UNITS, OCCUPIED, TENURE BY RACE OF HOUSEHOLDER | ||||
| Owner occupied: Map | 86,410 | 358,300 | 3,897,837 | 75,986,074 |
| Householder who is White alone Map | 78,026 | 295,219 | 3,237,592 | 63,446,275 |
| Householder who is Black or African American alone Map | 1,088 | 28,362 | 325,395 | 6,261,464 |
| Householder who is American Indian and Alaska Native alone Map | 66 | 401 | 11,250 | 509,588 |
| Householder who is Asian alone Map | 5,844 | 22,121 | 197,011 | 2,688,861 |
| Householder who is Native Hawaiian and Other Pacific Islander alone Map | 7 | 35 | 741 | 61,911 |
| Householder who is Some Other Race alone Map | 653 | 7,468 | 74,243 | 1,975,817 |
| Householder who is Two or More Races Map | 726 | 4,694 | 51,605 | 1,042,158 |
| Renter occupied: Map | 13,009 | 90,228 | 3,419,918 | 40,730,218 |
| Householder who is White alone Map | 10,510 | 58,332 | 1,931,571 | 26,308,077 |
| Householder who is Black or African American alone Map | 554 | 15,373 | 770,395 | 7,868,519 |
| Householder who is American Indian and Alaska Native alone Map | 33 | 332 | 22,574 | 430,119 |
| Householder who is Asian alone Map | 1,183 | 5,221 | 248,641 | 1,943,303 |
| Householder who is Native Hawaiian and Other Pacific Islander alone Map | 1 | 41 | 1,874 | 82,021 |
| Householder who is Some Other Race alone Map | 528 | 8,407 | 331,077 | 2,940,610 |
| Householder who is Two or More Races Map | 200 | 2,522 | 113,786 | 1,157,569 |
| HOUSING UNITS, OCCUPIED, TENURE BY HISPANIC OR LATINO ORIGIN OF HOUSEHOLDER | ||||
| Owner occupied: Map | 86,410 | 358,300 | 3,897,837 | 75,986,074 |
| Not Hispanic or Latino householder Map | 82,993 | 333,678 | 3,664,784 | 69,617,625 |
| Hispanic or Latino householder Map | 3,417 | 24,622 | 233,053 | 6,368,449 |
| Renter occupied: Map | 13,009 | 90,228 | 3,419,918 | 40,730,218 |
| Not Hispanic or Latino householder Map | 11,393 | 70,282 | 2,646,457 | 33,637,301 |
| Hispanic or Latino householder Map | 1,616 | 19,946 | 773,461 | 7,092,917 |
| HOUSING UNITS, OCCUPIED, TENURE BY HOUSEHOLD SIZE | ||||
| Owner occupied: Map | 86,410 | 358,300 | 3,897,837 | 75,986,074 |
| 1-person household Map | 12,926 | 58,809 | 860,611 | 16,453,569 |
| 2-person household Map | 26,284 | 104,827 | 1,304,752 | 27,618,605 |
| 3-person household Map | 16,411 | 65,788 | 660,251 | 12,517,563 |
| 4-person household Map | 18,450 | 70,305 | 606,580 | 10,998,793 |
| 5-person household Map | 8,325 | 35,213 | 279,929 | 5,057,765 |
| 6-person household Map | 2,691 | 13,432 | 106,323 | 1,965,796 |
| 7-or-more-person household Map | 1,323 | 9,926 | 79,391 | 1,373,983 |
| Renter occupied: Map | 13,009 | 90,228 | 3,419,918 | 40,730,218 |
| 1-person household Map | 4,827 | 31,483 | 1,270,059 | 14,751,340 |
| 2-person household Map | 3,464 | 22,452 | 911,018 | 10,624,023 |
| 3-person household Map | 1,918 | 13,701 | 516,252 | 6,240,422 |
| 4-person household Map | 1,575 | 10,810 | 362,887 | 4,626,453 |
| 5-person household Map | 679 | 5,886 | 190,334 | 2,480,866 |
| 6-person household Map | 284 | 2,777 | 86,654 | 1,108,903 |
| 7-or-more-person household Map | 262 | 3,119 | 82,714 | 898,211 |
Loading...